The beginning of a new year always marks a welcome occasion to look back.
In the year 2023, especially the second half, there had been a lot of momentum in the Image community in Galaxy. Without diving too much into details, the contemplative mood of the end of the year made me want to capture visually what had been going on.
For this occasion, I had dedicated some spare time of the holidays to needle a web-based tool which automatically creates graphical retrospectives of contributions to Galaxy and its various communuties. The emphasis of the tool was clearly put on the contributions as an ongoing process, meaning that it would have been insufficient to just analyze the latest state of the repositories, the code, or the tools harbored there. It seemed necessary to build a tool which crawls through the whole Git history of each possibly relevant GitHub repository.
In fact, this is the most striking difference of the newly built tool to the Galaxy Tool Metadata Extractor, which emerged at the BioHackathon Europe 2023. The contributions are extracted from the Git histories and cached more compactly. In addition, metadata concerning different Galaxy tools and communuties, is extracted for each contribution and stored along with the cached contributions. The metadata is extracted in a way widely adopted from the Galaxy Tool Extractor. Thanks to the incrementally updated cache, the graphical retrospectives can be created and updated very quickly, and automatic updates are scheduled weekly.
In order to attribute contributions to specific Galaxy communuties, a mapping from the set of Galaxy tools to the set of the Galaxy communuties is required. To not reinvent the wheel, the newly built tool directly exploits the mappings already specified in the Galaxy Tool Metadata Extractor. Both mappings and communities can be configured in the communities.yml file. Feel free to add yours!
The tool generates visualizations of the following quantities and relations:
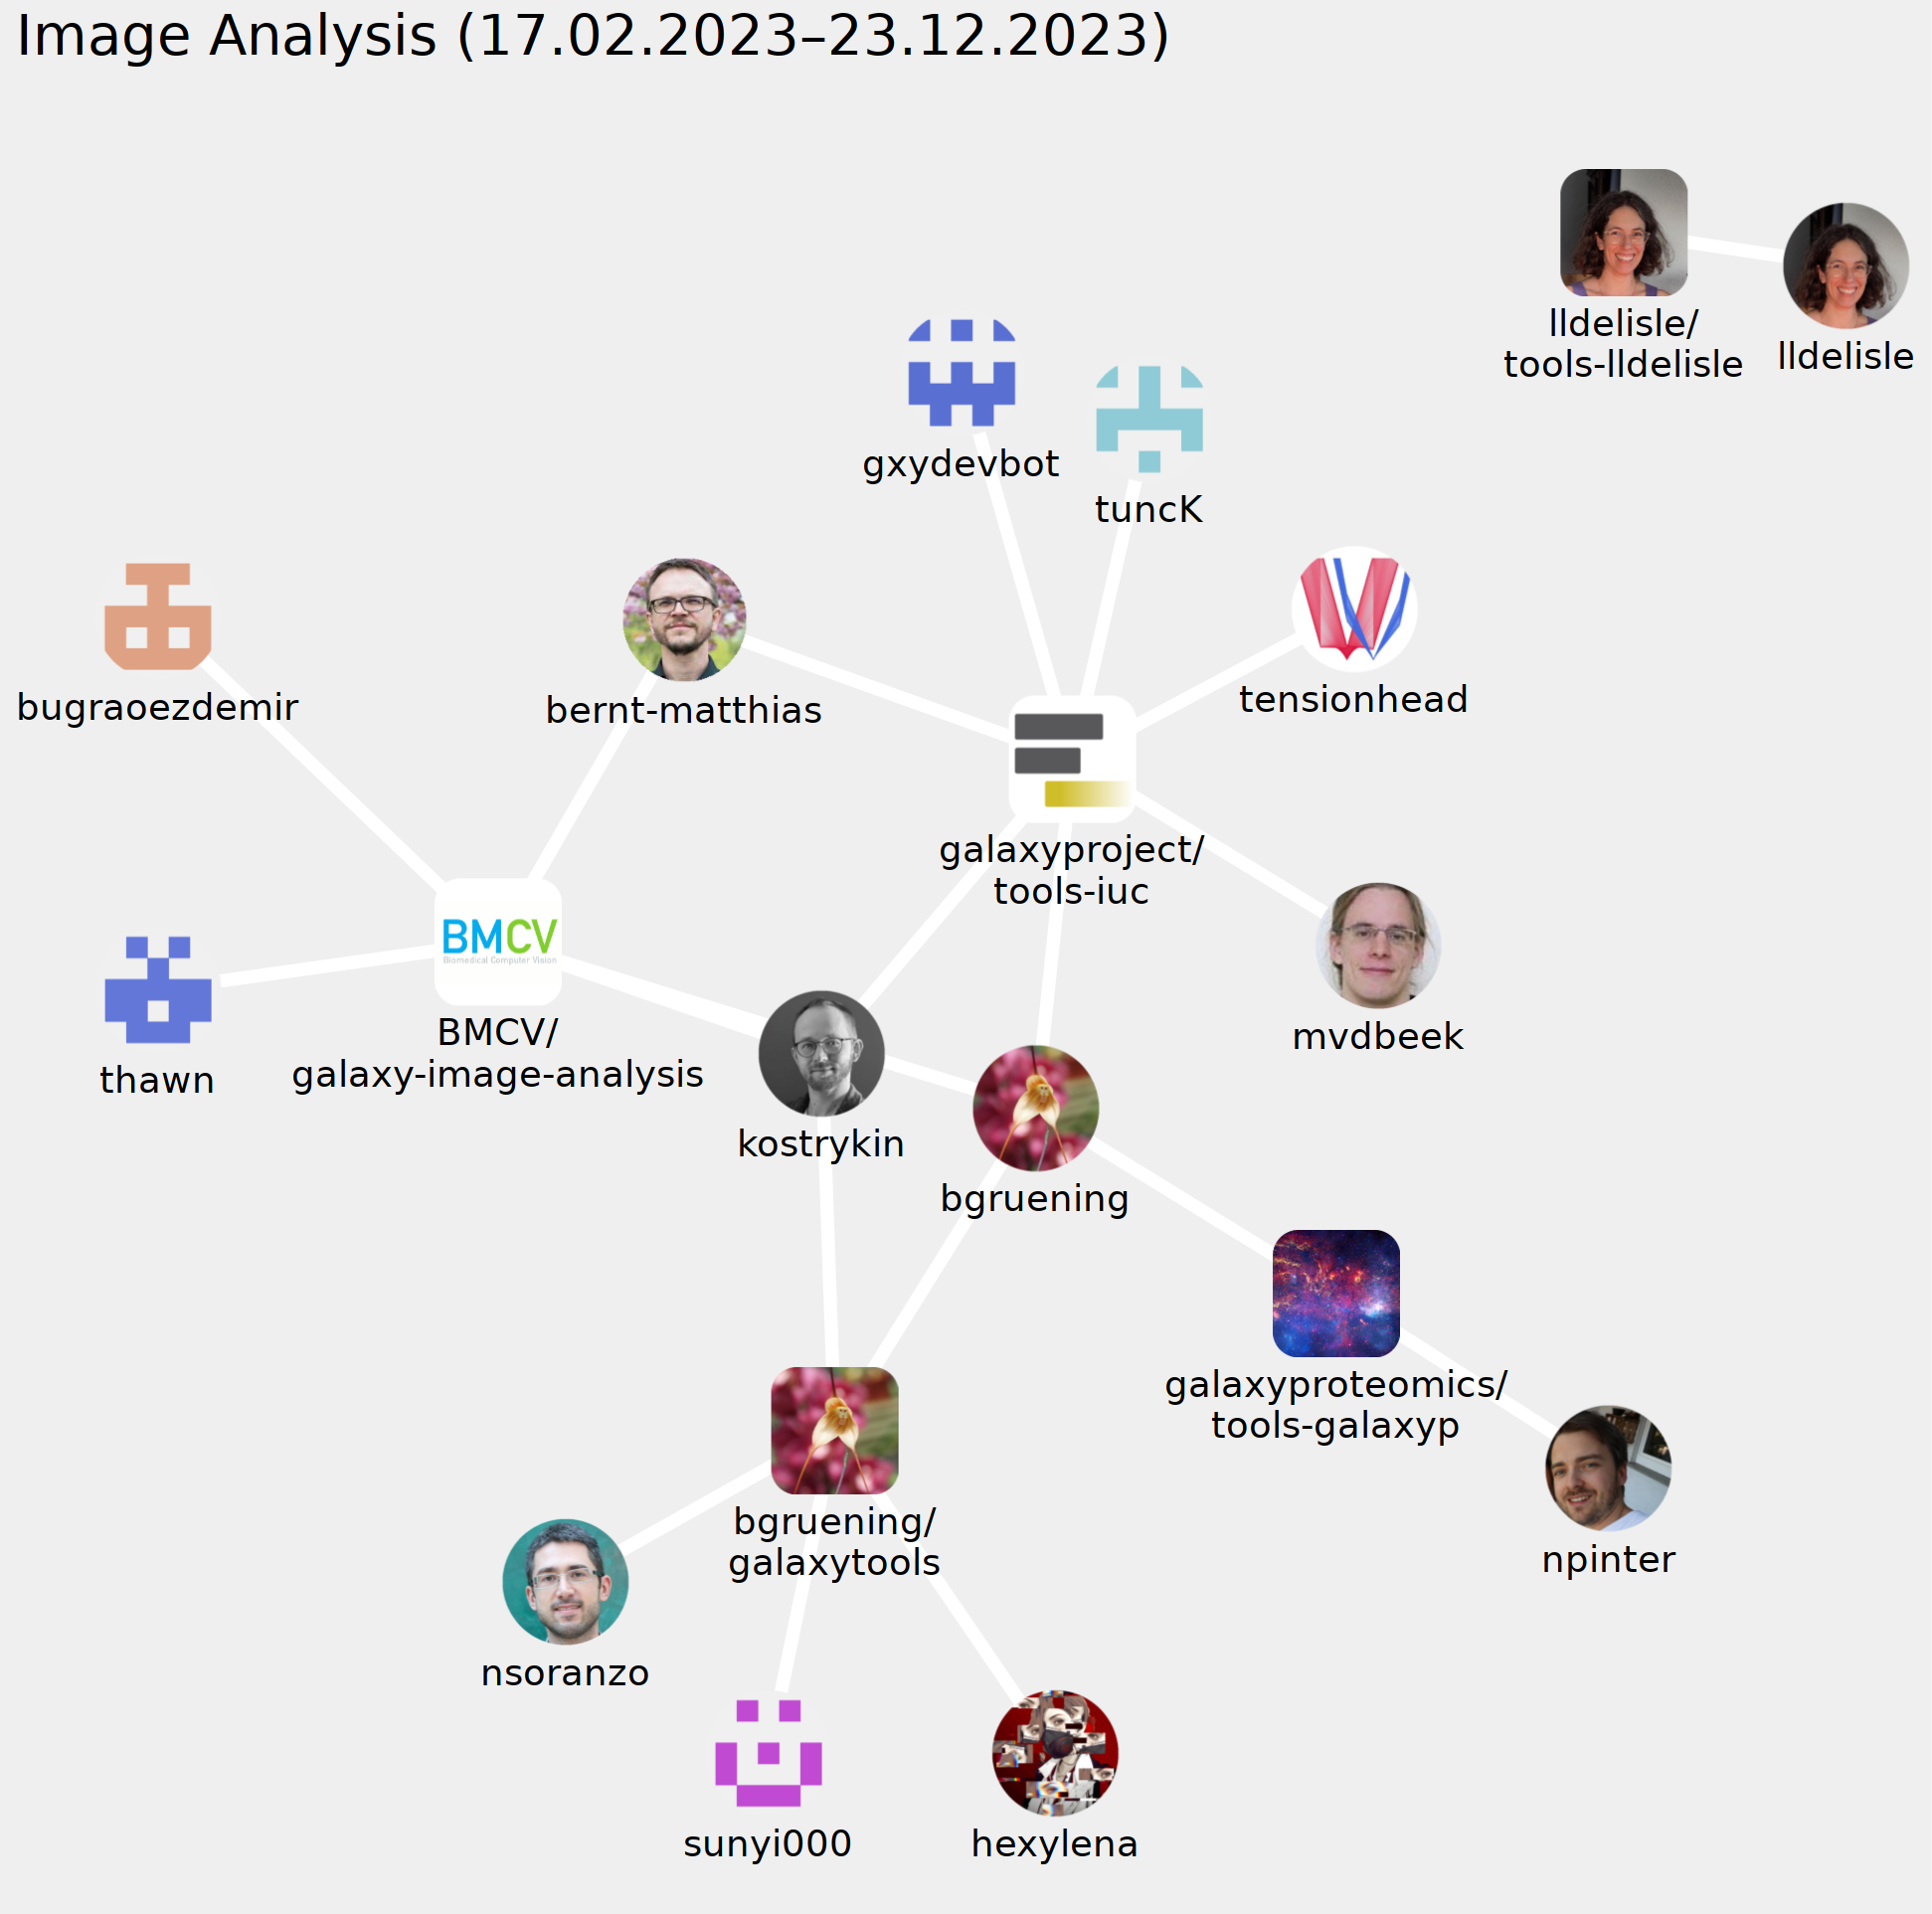
Community contribution graph. This is a visualization of the contributions made within a community during the last 356 days, where contributions are attributed to the community according to the specifications in the
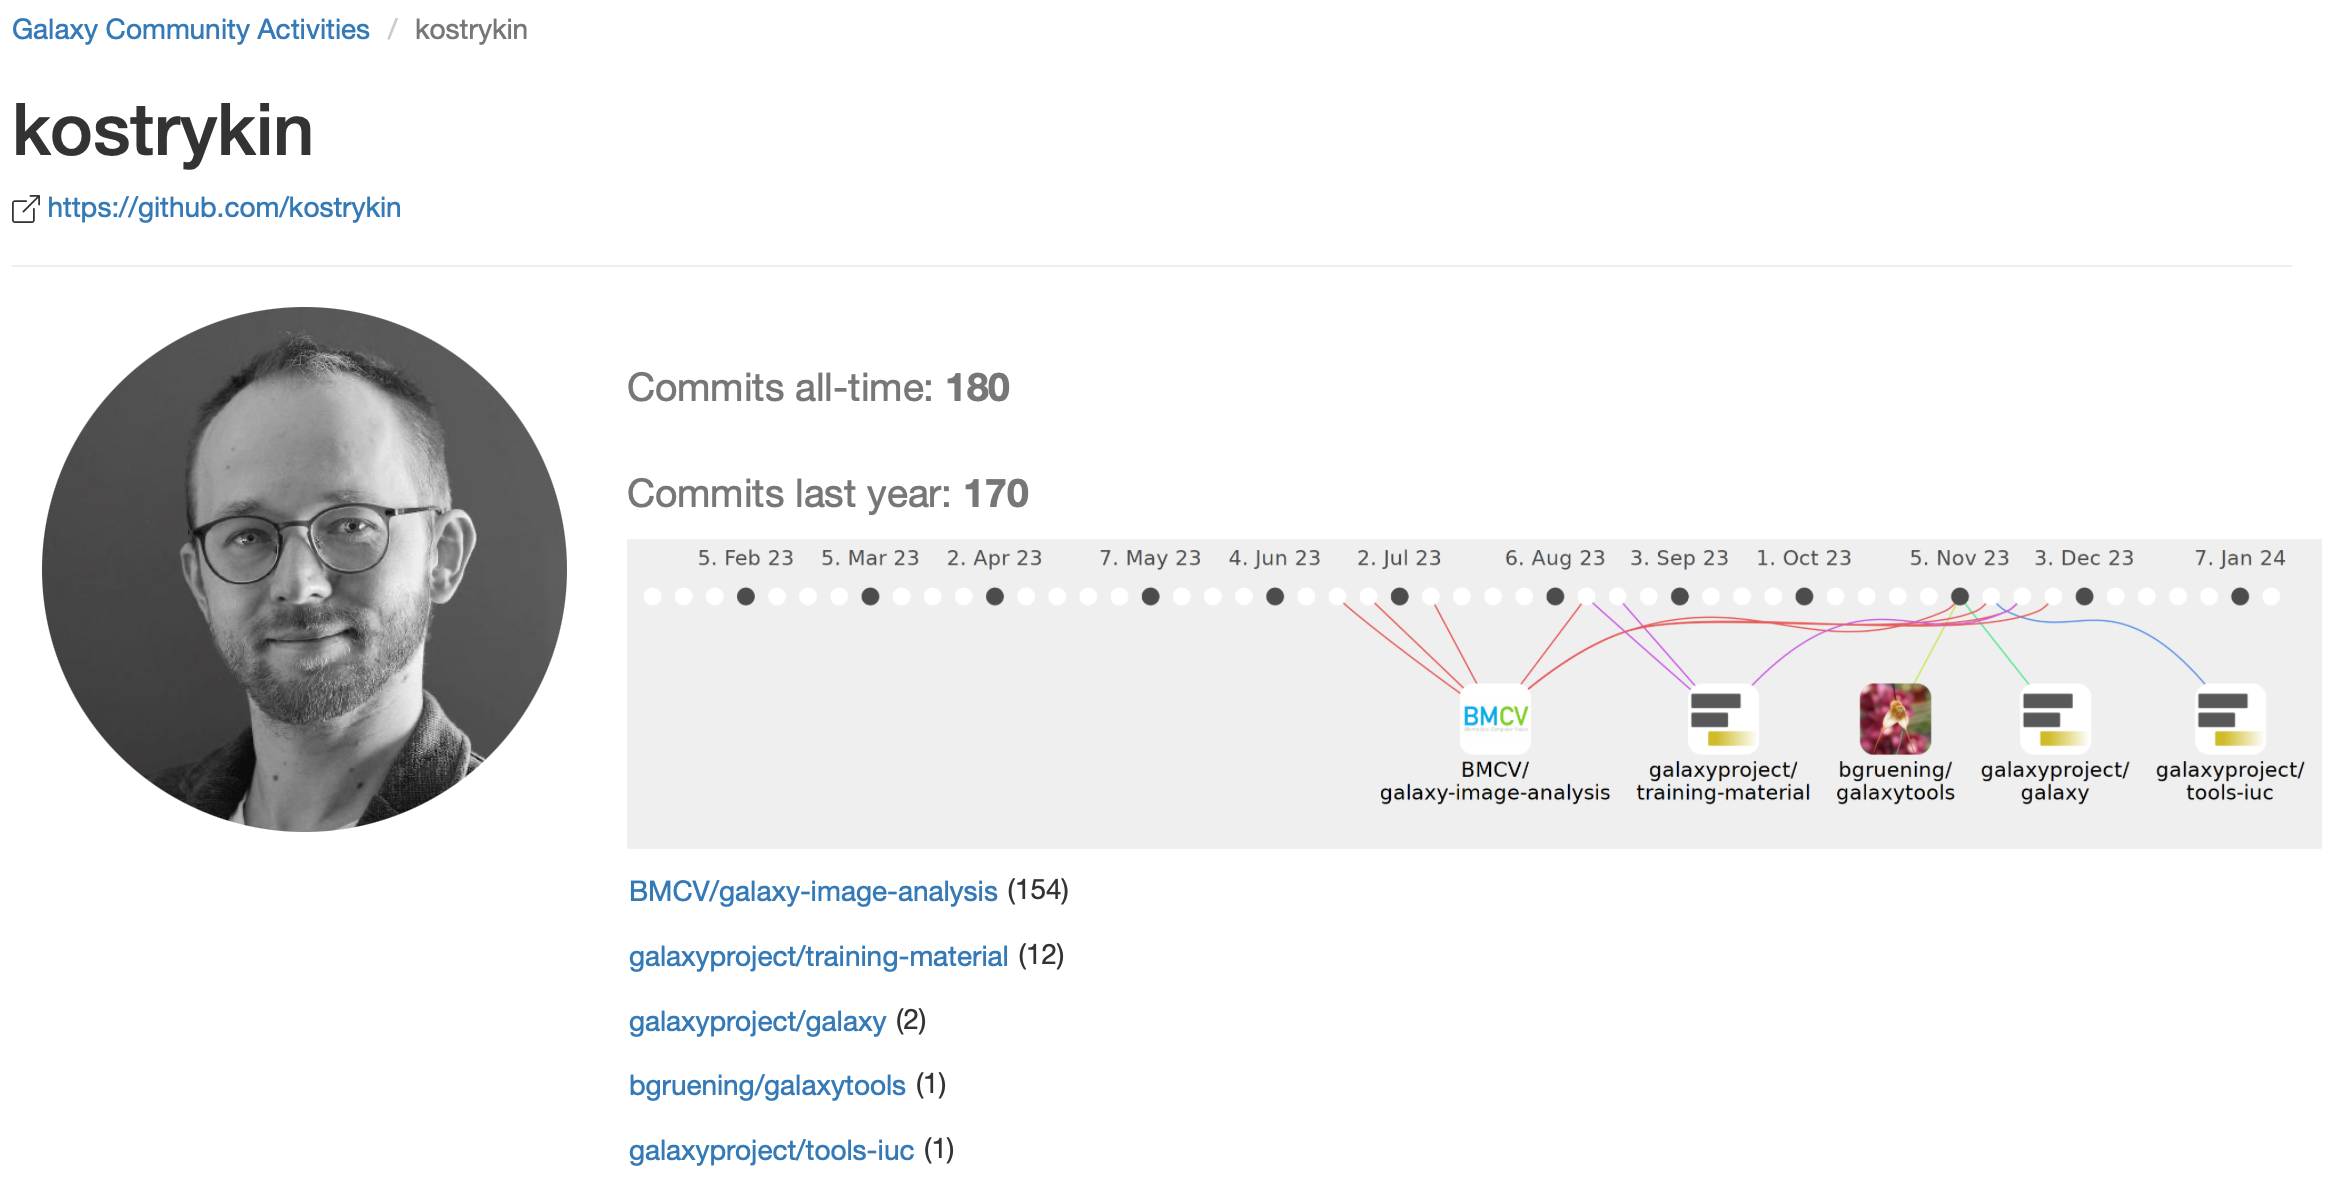
communities.ymlfile.Personal contribution timeline. This is essentially a bipartite graph, where every week of the last year is connected with the repositories, to which contributions had been made in that week. Personal contribution timelines are created for everyone who contributed to any known community during the last year.
Distribution of repositories. This pie chart illustrates how the tools of a community are scattered across the different repositories.
Repositories to be scanned can be configured via the repositories.yml file.
In addition to the visualizations described above, the tool also generates lists of (i) the all-time most frequent contributors, (ii) the last-year most frequent contributors, and (iii) newcomers (those who contributed for the first time during the last year to a community).
The tool is available on: https://kostrykin.github.io/galaxy-community-activities/report/